
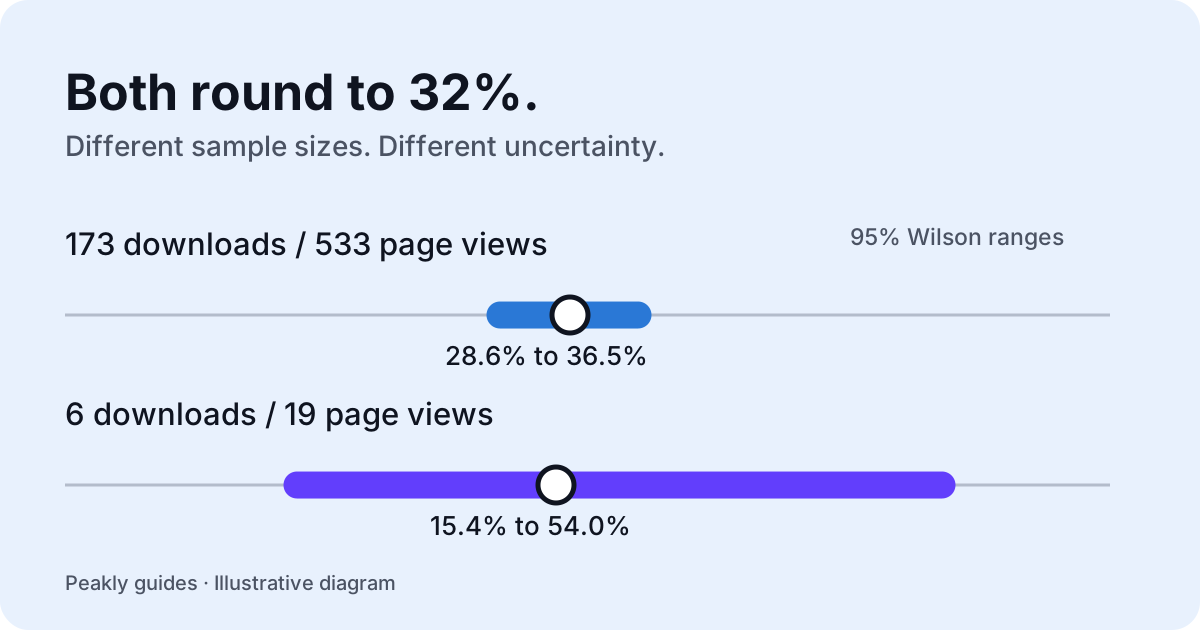
An App Store conversion rate is only useful when you know what is being divided, which traffic it describes, and how much evidence sits behind it. A percentage alone cannot tell you whether to rewrite a listing or bring more people to it. Start with the counts and the metric definition, then choose a change you can evaluate.
Check which conversion rate you are reading
Apple defines its Conversion Rate metric using total downloads and pre-orders divided by unique device impressions. Product page views are a different metric. Apple also distinguishes first-time downloads from redownloads. These definitions matter because a download can happen without someone opening the full product page. Read Apple's metric definitions before comparing figures from different reports.
Peakly keeps a separate question for the listing: how often do product page view events become page-attributed first-time downloads? Its page-conversion diagnosis uses those counts, not every download divided by every page view. That is different from Apple's overall acquisition conversion metric. A change in one does not automatically imply the same change in the other.
Before recording a result, write down the numerator, denominator, date window, app, and source. Keep these choices consistent in the next comparison. If your first figure includes redownloads and the next includes only first-time downloads, the apparent movement may be a definition change. A precise label is more useful than an impressive percentage with an unclear meaning.
Keep the sample size beside the percentage
Consider an illustrative example, not a customer's result: 173 page-attributed downloads from 533 page views is approximately 32.46%. Six from 19 is approximately 31.58%. Both round to 32%, but the second estimate has much less evidence behind it. Changing one observation has a larger effect when the denominator is small.
Peakly uses a 95% Wilson interval for its page-conversion diagnosis. In these examples the ranges are approximately 28.6% to 36.5% and 15.4% to 54.0%, respectively. The interval makes uncertainty visible. It does not prove that a future experiment will succeed, identify what caused the result, or turn aggregate report events into a controlled experiment.
The current policy also requires at least 30 product page views before making a high or low conversion verdict. Crossing that minimum does not guarantee a verdict: the interval must still clear the target. A range that overlaps it remains uncertain. You can inspect the calculation and policy in Peakly's conversion diagnosis.
Treat the target as a heuristic
Peakly currently uses a 25% page-conversion target. This is an explicit product heuristic, not an Apple benchmark or a claim that every app should reach the same rate. Category, audience, territory, and the route into a listing can affect what a comparison means. A label such as high is relative to the stated rule, not a universal judgment about your business.
When the evidence is thin, the practical next step can be to gather more relevant traffic while keeping the listing stable. Replacing the icon, screenshots, subtitle, and pricing together would make the next result harder to interpret. Waiting for clearer evidence is a deliberate decision, not a failure to optimize.
What is a good App Store conversion rate?
A useful comparison starts with the same metric and a relevant peer group. Apple provides peer-group benchmarks organized around comparable apps, including category, business model, and download volume. Review the available percentiles and the period they describe rather than borrowing a headline rate from an unrelated app.
Apple's overall acquisition conversion benchmark is not a benchmark for Peakly's page-conversion diagnosis. The denominator and download scope differ. A page ratio above Peakly's 25% heuristic does not establish that the app beats Apple's peer-group median. Keep the two questions separate when deciding whether the problem is exposure, the listing, or something after download.
Use a benchmark as context for a hypothesis, then inspect your own counts, source mix, and uncertainty. A relative position can identify something worth investigating without explaining its cause. For a new or small app, comparable historical evidence may be limited; the appropriate answer can remain uncertain. An exact-looking percentage should not erase that limitation.
Match the experiment to the source
Look at App Store download sources before choosing the asset to change. An app that gets many downloads straight from search results may depend heavily on the icon, name, and visible screenshots. Visitors who open the full listing encounter a different set of information. A single overall percentage can hide this distinction.
Pick one change and a comparison window before looking at the result. For example, an icon test could be assessed through search downloads per search impression across comparable periods. Keep the source and other filters consistent. Note a release or a campaign that changes the audience, because a different traffic mix can move the rate without the asset being responsible.
Define what would count as useful evidence
Write down the outcome you hope to see and a guardrail that would make the apparent improvement less convincing. More downloads accompanied by worse downstream behavior deserves investigation. Remember that aggregate outcomes in a period are not necessarily outcomes from the exact people who downloaded in that period.
Check how missing report data affects comparisons before treating a recent dip as a failed test. Peakly's insights separate observed numbers, possible explanations, a suggested experiment, and what to measure afterward. You run the experiment and assess its limits. Explore Peakly's current setup to examine those reports in the Mac app or a self-hosted web installation.