
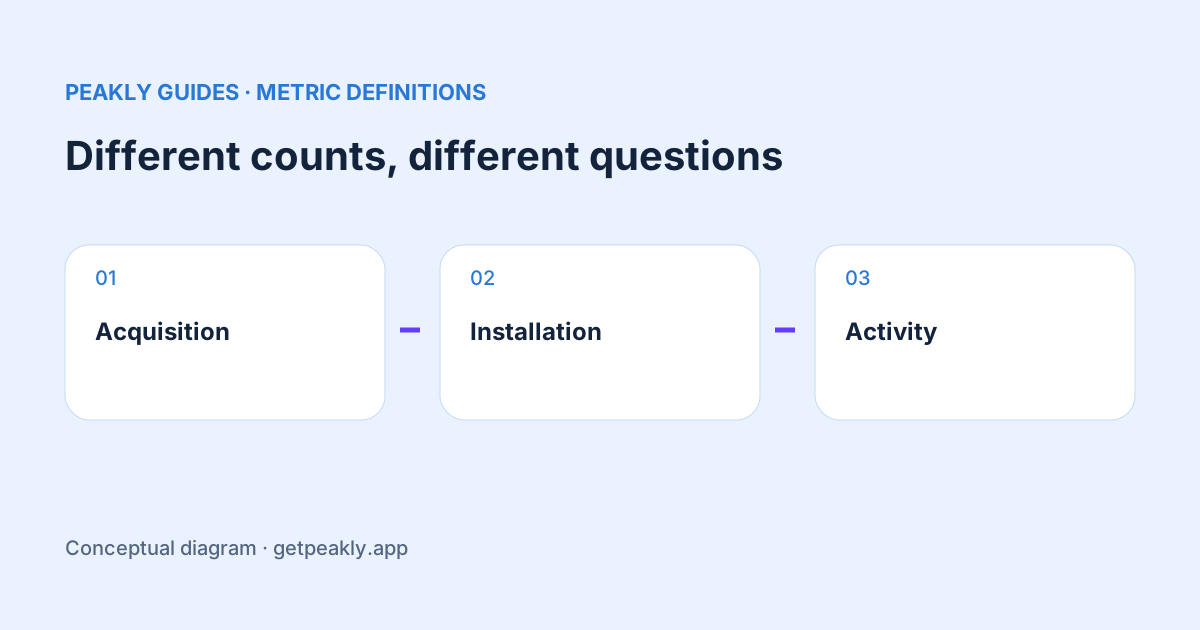
App Store downloads vs installations is not simply a comparison between people who wanted an app and people who successfully opened it. The reports use different definitions and coverage. Active devices adds another question about activity. Read each count in its own context before using the difference to diagnose onboarding, retention, or a broken release.
Give each metric a job
Use a download measure for a question about acquisition. Use an installation measure for a question about reported installations. Use active devices for a question about reported activity. Those plain-language labels make it harder to drift from an observed event to an unsupported claim about an individual person's behavior.
Apple distinguishes first-time downloads, redownloads, completed installations, and devices with a session. Usage reporting depends on analytics sharing. The detailed definitions are in Apple's metric reference. Read the scope of the particular field you exported instead of treating every dashboard total as a count of all customers.
The phrase “new users” is especially risky in an acquisition spreadsheet. Decide whether you mean a store download, a new account in your own system, or someone completing a meaningful action. You can monitor all three, but the labels should preserve the distinction. A store report cannot supply an account-creation event that your application has never measured.
Do not build a funnel from unrelated totals
Suppose a hypothetical week shows 200 first-time downloads, 80 reported installations, and 50 active devices. Subtracting 80 from 200 does not prove that 120 people failed to install. Dividing 50 by 200 does not establish that one quarter of that week's new customers returned. The totals do not identify the same set of people moving between steps.
Before calling a ratio a funnel conversion, ask whether the numerator and denominator refer to the same population and whether the outcome has had time to occur. If you cannot establish those conditions, give the ratio a literal name and explain its limits. A descriptive comparison can still help you notice a change without becoming an invented retention measure.
This same discipline applies earlier in discovery. Product page views are not required for every download path. The download sources guide explains why it helps to keep the source and the page behavior visible instead of forcing every acquisition event through one imagined journey.
Investigate a change within a consistent metric
When a count drops, compare that metric with itself over comparable periods first. Keep the app, filters, reporting scope, and time window stable. Then ask whether coverage changed, a release occurred, or the audience mix shifted. This sequence gives you a clearer starting point than comparing today's usage field with yesterday's acquisition field.
For a small app, inspect the underlying counts alongside percentages. A handful of additional sessions can create a large relative movement. An alarming percentage is a reason to check the sample, not proof of a new product problem. Use conversion and sample size for the same habit when reviewing listing performance.
Choose the measurement that answers your decision
If your decision is whether to rewrite a screenshot, examine acquisition and the relevant conversion evidence. If the decision concerns an onboarding step, define the behavior that would show the step working. That may require an event inside your app, an appropriately scoped cohort, or a usability observation. A more attractive store chart cannot substitute for the missing measurement.
If you are investigating a release, write down the specific symptom: fewer completed sessions, a crash pattern, a failed purchase, or a change in reported installations. These are different investigations. Avoid treating the broad word engagement as an explanation. A precise question helps you choose both the evidence and the next test.
Keep an interpretation note beside the chart
Record what the metric measures, whose data it covers, and what it cannot show. A two-line note is often enough to prevent the next person, or your future self, from reading the chart as a complete customer journey. Keep that note when exporting the report or sharing a screenshot with a teammate.
Peakly makes reported counts and caveats easier to review, while decisions still depend on using the appropriate evidence. Explore Peakly for a report-based view, and use the weekly analytics review to keep acquisition and usage questions separate. The useful result is an action tied to a metric that can actually answer it.